Stability indicating method development and validation for the simultaneous estimation of ledipasvir and sofosbuvir in bulk drug by using RP-HPLC
Abstract
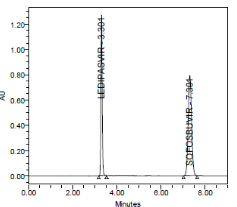
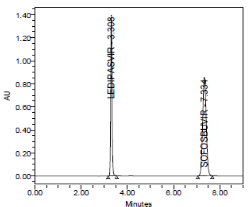
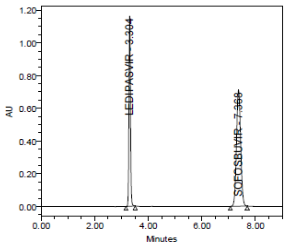
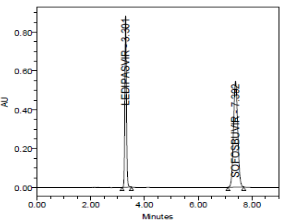
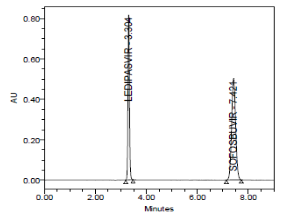
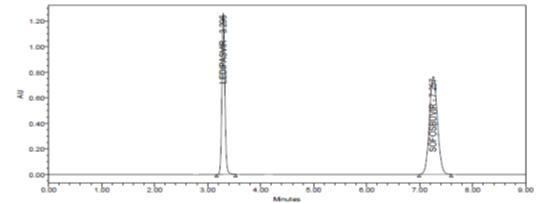
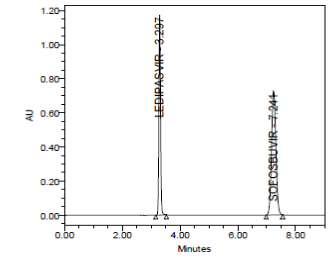
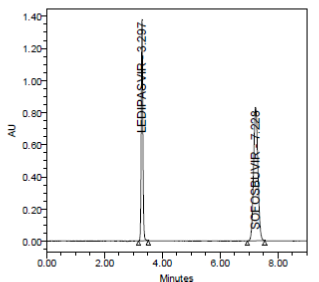
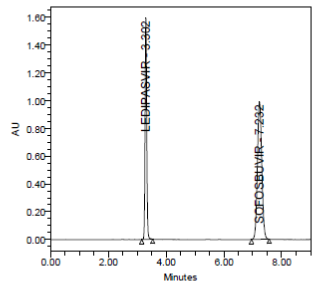
A new, simple, precise, accurate, and reproducible RP-HPLC for stability-indicating method development and validation of Ledipasvir and Sofosbuvir in bulk form. Separation of Ledipasvir and Sofosbuvir was successfully achieved Dona Zorbax C8, 250 X4.6mm, 5µm or equivalent in an isocratic mode utilizing 0.1% OPA: Methanol (45:55) at a flow rate of 1.0mL/min and the eluate was monitored at 238nm, with a retention time of 3.303 and 7.303minutes for Ledipasvir and Sofosbuvir respectively. The method was validated and their response was found to be linear in the drug concentration range of 45µg/ml to135 µg/ml for Ledipasvirand 200µg/ml to 600 µg/ml for and Sofosbuvir. The values of the correlation coefficient were found to 0.999 for Ledipasvirand 1 for Sofosbuvir respectively. The LOQ for Ledipasvirwere found to be 0.695 respectively. The LOQ for Sofosbuvir was found to be 2.2063 respectively. This method was found to be a good percentage recovery for Ledipasvir and Sofosbuvirwere found to be 100 and 100 respectively indicates that the proposed method is highly accurate. The specificity of the method shows a good correlation between retention times of standard with the sample so, the method specifically determines the analyte in the sample without interference from the excipients of tablet dosage forms. The method was extensively validated according to ICH guidelines for Linearity, Accuracy, Precession, Specificity, and Robustness.
Keywords
Ledipasvir, Sofosbuvir, High performance liquid chromatography and UV spectrometry
INTRODUCTION 1
Analytical methods development and validation play important roles in the discovery, development, and manufacture of pharmaceuticals. The current good manufacturing practice (CGMP) and Food Drug Administration (FDA) Guidelines insist for adoption of sound methods of analysis with greater sensitivity and reproducibility 2. Development of a method of analysis is usually based on prior art (or) existing literature, using the same (or) quite similar instrumentation 3. It is rare today that an HPLC-based method is developed that does not in same way relate (or) compare to existing, literature based approaches. Today HPLC (High performance liquid chromatography) is the method of choice used by the pharmaceutical industry to assay the intact drug and degradation products. In recent years, several analytical techniques have been evolved that combined two or more methods into one called “hyphenated” technique eg: GC/MS, LC/MS etc. The complete Analysis of a substance consists of four main steps.
Newer analytical methods are developed for these drugs or drug combinations of the below reasons 2
-
There may not be suitable method for a particular analyte in the specific matrix.
-
Existing method may be too error prone or unreliable (have poor accuracy and precision).
-
Existing method may be expensive, time consuming, energy intensive and may not be provide sensitive or analyte selectivity, and not easy for automation.
-
Newer instrumentation and techniques may have evolved that provide opportunities for improved methods.
-
There may be need for an alternate method to confirm, for legal and scientific reasons.
The newly developed analytical methods having their importance in different fields that include, research and development centre (R&D), Quality control department (QC).
AIM OF WORK 2
To develop a sensitive, simple, rapid, accurate and Stability indicating analytical method for the simultaneous estimation of Ledipasvir and Sofosbuvir and validation
PLAN OF WORK 3
The plan of proposed work includes the following steps:
a) The extensive survey of literature for drug regarding the physicochemical properties, pharmacological action and analytical methods.
b) Method development by RP-HPLC
-
Selection of suitable wave length.
-
Selection of chromatographic technique.
-
Method development trails
-
Optimization of chromatographic condition.
b)Validation of developed method using following parameters as per the ICH guidelines.
-
System suitability
-
Specificity
Forced degradation studies
-
Acidic degradation
-
Base degradation
-
Oxidative degradation
-
Thermal degradation
-
Photo degradation
-
Linearity
-
Precision
-
Accuracy
-
Robustness
-
Limit of quantification
INSTRUMENTS/EQUIPMENTS USED 4
Instruments:
-
WATERS HPLC, Model: Agilent 2695, Photo diode array detector (PDA), with an automated sample injector. The output signal was monitored and integrated using Empower 2 software. ELIPSE C8 (150mm*4.6, 5 mm, Make: Waters) column was used for separations.
List of Equipment’s5
|
S.NO |
Equipment’s |
Model |
Company |
|
1 |
Electronic Balance |
ER200A |
ASCOSET |
|
2 |
Ultra-Sonicator |
SE60US |
ENERTECH |
|
3 |
Heating Mantle |
BTI |
BIO TECHNICS INDIA |
|
4 |
Thermal oven |
--------- |
NARANG |
|
5 |
pH Meter |
AD102U |
ADWA |
|
6 |
Filter Paper 0.45 microns |
--------- |
MILLI PORE |
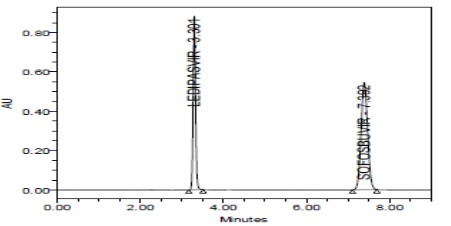
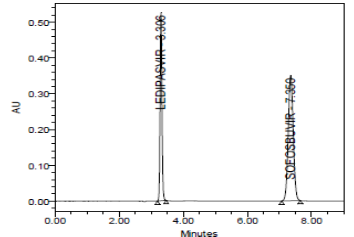
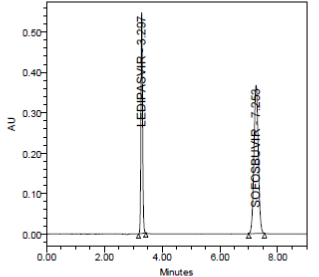
METHOD DEVELOPMENT TRAIL OPTIMISED:
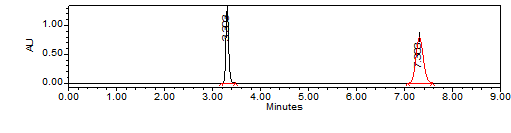
Observation:RT was found to be good and the peak symmetry of both drugs were good. And the resolution theoretical plate count and tailing were within the limits and it is used for validation of the method.
|
Name |
Retention Time |
Area |
USP Resolution |
USP Tailing |
USP Plate Count |
|
|
1 |
Ledipasvir |
3.303 |
5125885 |
1.11 |
15887 |
|
|
2 |
Sofosbuvir |
7.303 |
8424190 |
20.23 |
1.08 |
10569 |
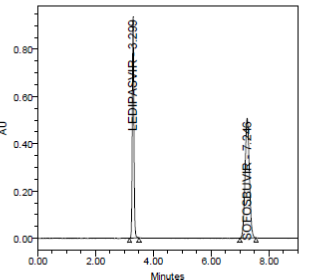
OPTIMIZED METHOD FOR RP-HPLC
Mobile Phase: 0.1% OPA: Methanol (45:55)
Column: Zorbax 250X 4.6mm, 5µm, C8
Flow Rate: 1.0ml/Min
Temperature: 30˚C
Volume: 10µl
Detector: PDA
Procedure:Inject 10μL of standard, sample into chromatographic system and measure the areas for the Ledipasvir and Sofosbuvirpeaks and calculate the % assay by using the formula
PREPARATION OF MOBILE PHASE 5
Transfer 1000ml of HPLC water into 1000ml of beaker add 0.1%OPA.
Transfer the above solution 450ml of0.1%OPA, 550ml of Methanol is used as mobile phase. They are mixed and sonicated for 20min.
PREPARATION OF THE LEDIPASVIR AND SOFOSBUVIR STANDARD AND SAMPLE SOLUTION 5
PREPARATION OF STANDARD SOLUTION:
Accurately weigh and transfer 90mg of Ledipasvir and 400mg Sofosbuvirinto 100ml of volumetric flask and add 10ml of Methanol and sonicate 10min (or) shake 5min and make with water. Transfers the above solution into 2.5ml into 25ml volumetric flask dilute to volume with water.
PREPARATION OF SAMPLE STOCK SOLUTION
Commercially available 20 tablets ware weighed and powdered the powdered equivalent to the 519.7mg of Ledipasvir and Sofosbuvir of active ingredients were transfer into a 100ml of volumetric flask and add 10ml of Methanol and sonicate 20 min (or) shake 10min and makeup with water.
Transfers above solution 2.5ml into 25ml of the volumetric flask dilute the volume with Methanol. And the solution was filtered through 0.45μm filter before injecting into HPLC system.
METHOD VALIDATION 6, 7, 8
SYSTEM SUITABILITY:
Tailing factor for the peaks due to Ledipasvir and Sofosbuvirin standard solution should not be more than 2.0.Theoretical plates for the Ledipasvir and Sofosbuvirpeaks in standard solution should not be less than 2000.
SPECIFICITY:
Specificity studies were carried for both pure drugs and drug product by comparing with blank and placebo. These blanks and placebo were compared with standard and sample shows that the analyte chromatographic peak is not attributable to more than one component as the impurities are not available.
Forced Degradation Studies 6
In the present investigation, as there was no interference of impurities with the analyte peaks, forced degradation studies were conducted with the same LC conditions developed to separate drug peaks of interest from their degradants which proves the stability indicating power of the method. Intentional degradation was attempted to various stress conditions such as acid hydrolysis (using 1.0N HCl), base hydrolysis (using 1.0 N NaOH), oxidative hydrolysis (using 3.0%v/v H2O2), thermal degradation (heated at 70°C for 14 days) and photolytic degradation (to overall illumination of ≥210Wh/m2 at room temperature with UV light for 14 days), to evaluate the ability of the proposed method to separate Ledipasvir and Sofosbuvir from their degradation products. Acidic hydrolysis: Forced degradation in acidic media was performed by taking accurately weighed samples of 519.7mg of Ledipasvir and Sofosbuvir each in separate 5mL volumetric flasks. Then 2mL of 1N HCl was added, made to dissolve and final volume was made up to the mark with 1N HCl to get mg/mL solutions and these were kept at 70ºC for 2 days and analyzed after suitable dilution.
Basic hydrolysis:
Forced degradation in basic media was performed by dissolving separately an accurately weighed quantities (122.5mg each) of Ledipasvir and Sofosbuvir in 1N NaOH in 5mL volumetric flasks and final volume was made up to 5mL with the same to get mg/mL solutions and these solutions were kept at 70ºC for 2 days and analyzed after suitable dilution.
Oxidative degradation:
Oxidative degradation studies were carried out in 3% (v/v) H2O2. Stock solutions of 122.5mg/mL of Ledipasvir and Sofosbuvir were prepared and kept at 70ºC for 2 days and analyzed after suitable dilution. Photo Degradation: For photolytic stress, samples of drug substances in solid state were irradiated with UV radiation (overall illumination of ≥210Wh/m2 at room temperature with UV radiation), for 14 days. Stock solutions of 1mg/mL were prepared in methanol from the exposed drug substances individually.
Thermal Degradation:
For thermal stress, 122.5mg of samples of drug substances in solid state were packed in glass vials and placed in a controlled temperature oven at 70°C for 14 days. Stock solutions of 1mg/mL were prepared in methanol from the exposed drug substances individually. For HPLC analysis, all the stressed sample solutions were diluted with mobile phase to obtain final concentration of 60μg/mL of Ledipasvir and Sofosbuvir and 100μg/mL of Rabeprazole respectively. Similarly, mixture of both drugs in a concentration of 60μg/mL of Ledipasvir and Sofosbuvir and 100μg/mL of Rabeprazole was prepared prior to analysis by HPLC. Besides, solutions containing 60μg/mL of Ledipasvir and Sofosbuvir and 100μg/mL of Rabeprazole for each drug separately were also prepared without performing the degradation of both the drugs. Then 20μL of above solutions were injected into the HPLC system and analyzed.Solution of standard, sample, blank and placebo were prepared as per test procedure and injected into the HPLC system.
Acceptance criteria:
Chromatogram of standard and sample should be identical with near Retention time.
Blank interference
A study to establish the interference of blank was conducted. Diluent was injected into HPLC system as per the test procedure.
Acceptance criteria
Chromatogram of blank should not show any peak at the retention time of analyte peak. There is no interference due to blank at the retention time of analyte. Hence, the method is specific.
LINEARITY
Prepare a series of standard solutions and inject into HPLC system. Plot the graph of standard versus the actual concentration in µg/ml and determine the coefficient of correlation and basis for 100% response.
Acceptance criteria
Linearity regression coefficient of average peak area response of replicate injections plotted against respective concentration should not be less than 0.999. The % y-intercept as obtained from the linearity data (without extrapolation through origin 0, 0) should be within ±2.0.
Statistical Evaluation
A graph between the concentration and the average area was plotted. Points for linearity were observed. Using the method of least squares, a line of best fit was taken and the correlation Coefficient, slope and, y-intercept were calculated.
PRECISION
Preparation of sample
-
Transfer the 122.5mg of sample into a 100ml of volume at flask and add 10ml of water and 10ml of Methanol and sonicate 20min and makeup with water. Transfer the above solution into 2.5ml into 25ml volume metric flask dilute to the volume with water.
-
The method precision parameters were evaluated from sample chromatograms obtained, by calculating the % RSD of peek areas from 6 replicate injection.
Acceptance criteria: The injection reproducibility requirements are met if the %RSD for peak areas is not more than 2.0 and for retention times is not more than 2.0.
RECOVERY/ACCURACY
Recovery study can be performed in the concentration range of 80% to 120% of the target concentration of the test. Minimum 3 concentrations are recommended.
Acceptance criteria:
The average percentage recovery was between 98-102% and Relative standard deviation of these recovery concentrations was less than 2%.
RESULTS AND DISCUSSION
SYSTEM SUITABILITY:
|
Parameter |
Ledipasvir |
Sofosbuvir |
Acceptance criteria |
|
Retention time |
3.303 |
7.303 |
+-10 |
|
Theoretical plates |
17053 |
10841 |
>2500 |
|
Tailing factor |
1.10 |
1.07 |
<2.00 |
|
% RSD |
0.7 |
0.8 |
<2.00 |
|
S.no |
Sample name |
RT |
Area |
USP plate count |
USP tailing |
|
1. |
Injection1 |
3.301 |
5154154 |
15844 |
1.12 |
|
2. |
Injection 2 |
3.308 |
5584697 |
16253 |
1.10 |
|
3. |
Injection 3 |
3.304 |
4622291 |
16360 |
1.09 |
|
4. |
Injection 4 |
3.301 |
3607569 |
15504 |
1.10 |
|
5. |
Injection 5 |
3.304 |
3336067 |
15520 |
1.09 |
|
S.no |
Sample name |
RT |
Area |
USP plate count |
USP tailing |
|
1. |
Injection 1 |
7.301 |
8518567 |
10496 |
1.08 |
|
2. |
Injection 2 |
7.334 |
9220560 |
10564 |
1.08 |
|
3. |
Injection 3 |
7.368 |
7640607 |
10781 |
1.07 |
|
4. |
Injection 4 |
7.392 |
5932037 |
10553 |
1.06 |
|
5. |
Injection 5 |
7.421 |
5512700 |
10416 |
1.06 |
RESULT
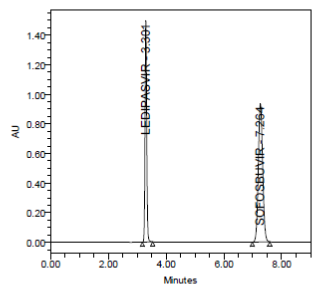
Results of system suitability study are summarized in the above table. Six consecutive injections of the standard solution showed uniform retention time, theoretical plate count, tailing factor and resolution for both the drugs which indicate a good system for analysis.
SPECIFICITY:
Specificity data for Ledipasvir and Sofosbuvir
|
S no |
Sample name |
Ledipasvirarea |
Rt |
Sofosbuvir Area |
Rt |
|
1 |
Standard |
4460355 |
3.301 |
7364894 |
7.301 |
|
2 |
Sample |
4460496 |
3.296 |
7363003 |
7.257 |
|
3 |
Blank |
- |
- |
- |
- |
|
4 |
Placebo |
- |
- |
- |
- |
|
Type of stress |
Degradation products/ Drug (D) |
Retention time |
% Area |
Peak purity |
Result |
|
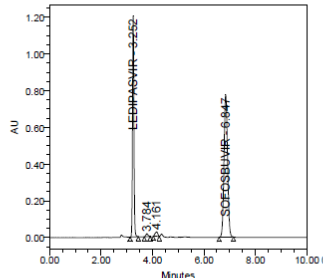
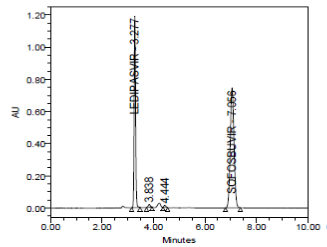
Acidic Hydrolysis (mg/mL in 1N HCl) at 70ºC for 2 days |
- |
3.252 |
4236590 |
0.999 |
Passed |
|
Basic Hydrolysis (mg/mL in 1N NaOH) at 70ºC for 2 days |
- |
3.265 |
4227521 |
0.999 |
Passed |
|
Oxidative Hydrolysis (mg/mL in 3% v/v H2O2) at 70 ºC for 2 days |
|
||||
|
- |
3.277 |
4299323 |
0.999 |
Passed |
|
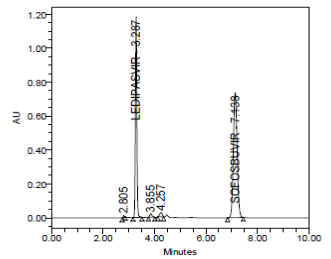
|
Photo Degradation (to UV light) for 14 days |
- |
3.287 |
4261372 |
0.999 |
Passed |
|
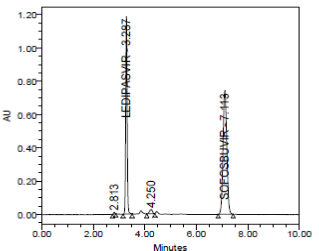
Thermal Degradation at 70ºC for 14 days |
- |
3.287 |
4213277 |
0.999 |
Passed |
|
Type of stress |
Degradation products/ Drug (D) |
Retention time |
% Area |
Peak purity |
Result |
|
Acidic Hydrolysis (mg/mL in 1N HCl) at 70ºC for 2 days
|
- |
6.847 |
7039509 |
0.999 |
passed |
|
Basic Hydrolysis (mg/mL in 1N NaOH) at 70ºC for 2 days
|
0.999 |
passed |
|||
|
- |
6.977 |
7081666 |
0.999 |
passed |
|
|
Oxidative Hydrolysis (mg/mL in 3% v/v) at 70 ºc for 2 days |
- |
7.056 |
7045562 |
0.999 |
passed |
|
Photo Degradation (to UV light) for 14 days
|
- |
7.138 |
7066831 |
0.999 |
passed |
|
Thermal Degradation at 70ºC for 14 days |
- |
7.113 |
7027361 |
0.999 |
passed |

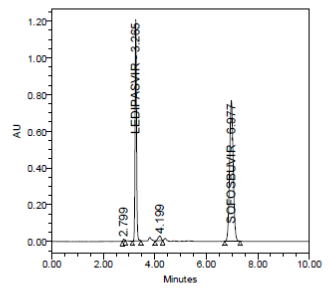
RESULT
The forced degradation study showed the method was highly specific, the chromatographic peaks does not interfere with any other impurities. This proves that, excipients have no effect on the analytical method. On the other hand, blank peak did not overlap drug peak. So the method is highly selective.
ACCURACY:
Accuracy data for Ledipasvir
|
S.NO |
Accuracy Level |
injection |
Sample area |
RT |
|
1 |
50% |
1 |
2234211 |
3.306 |
|
2 |
2238492 |
3.306 |
||
|
3 |
2237285 |
3.300 |
||
|
2 |
100% |
1 |
4462488 |
3.304 |
|
2 |
4466089 |
3.306 |
||
|
3 |
4462709 |
3.305 |
||
|
3 |
150% |
1 |
6693297 |
3.301 |
|
2 |
6690064 |
3.300 |
||
|
3 |
6695603 |
3.302 |
|
S.NO |
Accuracy Level |
Sample Name |
Sample weight |
μg/ml added |
μg/ml found |
% Recovery |
% Mean |
|
1 |
50% |
1 |
61.25 |
44.550 |
44.67 |
100 |
100 |
|
2 |
61.25 |
44.550 |
44.76 |
100 |
|||
|
3 |
61.25 |
44.550 |
44.73 |
100 |
|||
|
2 |
100% |
1 |
122.50 |
89.100 |
89.22 |
101 |
100 |
|
2 |
122.50 |
89.100 |
89.29 |
100 |
|||
|
3 |
122.50 |
89.100 |
89.23 |
100 |
|||
|
3 |
150% |
1 |
183.75 |
133.650 |
133.82 |
100 |
100 |
|
2 |
183.75 |
133.650 |
133.76 |
100 |
|||
|
3 |
183.75 |
133.650 |
133.87 |
100 |
|
S.NO |
Accuracy Level |
injection |
Sample area |
RT |
|
1 |
50% |
1 |
3685084 |
7.350 |
|
2 |
3684559 |
7.329 |
||
|
3 |
3688142 |
7.308 |
||
|
2 |
100% |
1 |
7362645 |
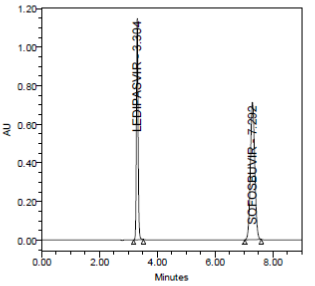
7.292 |
|
2 |
7366522 |
7.292 |
||
|
3 |
7362418 |
7.276 |
||
|
3 |
150% |
1 |
11041980 |
7.264 |
|
2 |
11047612 |
7.254 |
||
|
3 |
11043057 |
7.247 |
|
S.NO |
Accuracy level |
Sample Name |
Sample weight |
μg/ml added |
μg/ml found |
% Recovery |
% Mean |
|
1 |
50% |
1 |
61.25 |
200.000 |
199.54 |
100 |
100 |
|
2 |
61.25 |
200.000 |
199.51 |
100 |
|||
|
3 |
61.25 |
200.000 |
199.71 |
100 |
|||
|
2 |
100% |
1 |
122.50 |
400.000 |
398.68 |
100 |
100 |
|
2 |
122.50 |
400.000 |
398.89 |
100 |
|||
|
3 |
122.50 |
400.000 |
398.67 |
100 |
|||
|
3 |
150% |
1 |
183.75 |
600.000 |
597.91 |
100 |
100 |
|
2 |
183.75 |
600.000 |
598.21 |
100 |
|||
|
3 |
183.75 |
600.000 |
597.97 |
100 |
RESULT
Results of accuracy study are presented in the above table. The measured value was obtained by recovery test. Spiked amount of both the drug were compared against the recovery amount.
% Recovery was 100.00% for Ledipasvirand 100.00% forSofosbuvir. All the results indicate that the method is highly accurate.
PRECISION:
|
S.no |
RT |
Area |
%Assay |
|
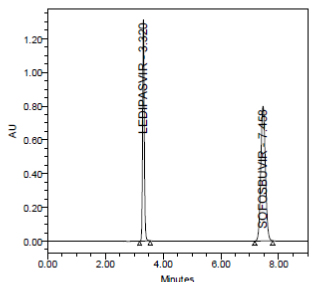
injection1 |
3.320 |
4465231 |
99 |
|
injection2 |
3.321 |
4462350 |
99 |
|
injection3 |
3.316 |
4464645 |
100 |
|
injection4 |
3.312 |
4462083 |
99 |
|
injection5 |
3.313 |
4468154 |
100 |
|
injection6 |
3.312 |
4466897 |
99 |
|
Mean |
99 |
||
|
Std. Dev. |
0.18 |
||
|
% RSD |
0.18 |
|
S.no |
RT |
Area |
%Assay |
|
injection1 |
7.458 |
7360011 |
100 |
|
injection 2 |
7.471 |
7368755 |
100 |
|
injection 3 |
7.451 |
7364800 |
100 |
|
injection 4 |
7.419 |
7365230 |
100 |
|
injection 5 |
7.398 |
7361573 |
100 |
|
injection 6 |
7.370 |
7361600 |
100 |
|
Mean |
100 |
||
|
Std. Dev. |
0.12 |
||
|
%RSD |
0.12 |
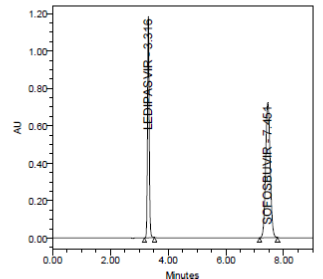
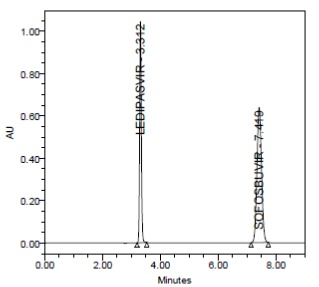
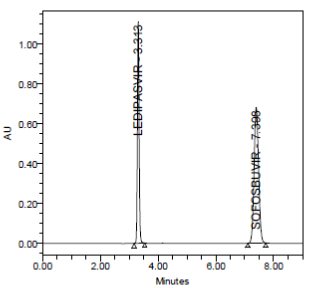
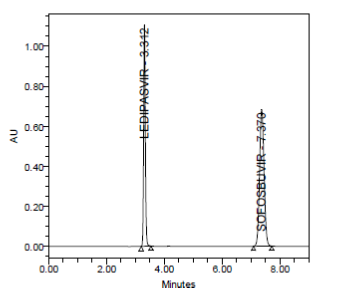
RESULT
Results of variability were summarized in the above table. % RSD of peak areas was calculated for various run. Percentage relative standard deviation (%RSD) was found to be less than 2% which proves that method is precise.
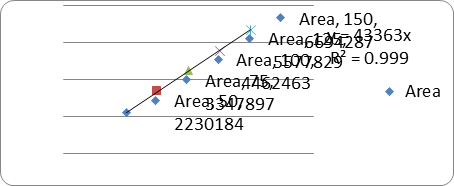
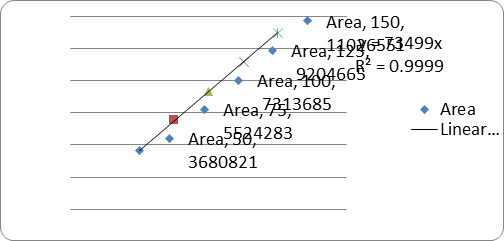
LINEARITY:
|
s.no |
Conc(μg/ml) |
RT |
Area |
|
1. |
50 |
3.297 |
2230184 |
|
2. |
75 |
3.299 |
3347897 |
|
3. |
100 |
3.297 |
4462463 |
|
4. |
125 |
3.297 |
5577829 |
|
5. |
150 |
3.302 |
6694287 |
|
Correlation coefficient (r2) |
0.999 |
||
|
s.no |
Conc(μg/ml) |
RT |
Area |
|
1. |
50 |
7.253 |
3680821 |
|
2. |
75 |
7.246 |
5524283 |
|
3. |
100 |
7.241 |
7363685 |
|
4. |
125 |
7.228 |
9204665 |
|
5. |
150 |
7.232 |
11026551 |
|
Correlation coefficient (r2) |
0.999 |
||
RESULT
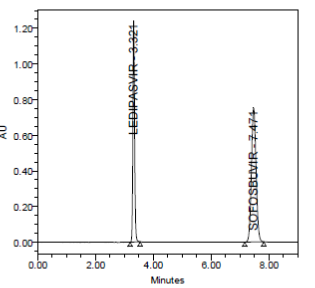
A linear relationship between peak areas versus concentrations was observed for Ledipasvir and Sofosbuvirin the range of 50% to 150% of nominal concentration. Correlation coefficient was 0.999 for both Ledipasvir and Sofosbuvirwhich prove that the method is linear in the range of 50% to 150%.
SUMMARY AND CONCLUSION
It was concluded that there was no stability indicating method reported for the above selected multi component dosage form, which promote to pursue the present work. The scope and objective of the present work is to develop and validate a new simple Stability Indicating RP-HPLC method for Ledipasvir and Sofosbuvirin bulk form. In simultaneous RP-HPLC method development, Waters HPLC with PDA detector and column used is Zorbax C8 (250 X 4.6mm) column with 5-micron particle size. Injection volume of 10 µL is injected and eluted with the mobile phase selected after optimization was 0.1% OPA and Methanol in the ratio of 45:55 was found to be ideal. The flow rate was found to be optimized at 1.0 mL/min. Detection was carried out at 236 nm. Quantitation was done by external standard method with the above mentioned optimized chromatographic condition. This system produced symmetric peak shape, good resolution and reasonable retention times of Ledipasvir and Sofosbuvir were found to be 3.303 and 7.303minutes respectively. The Ledipasvir and Sofosbuvir showed linearity in the range of 50-150µg/mL and 50-150µg/mL respectively. The slope and correlation coefficient values for Ledipasvir were found to be 43363 and 0.999respectivelyand 73499 and 0.999 respectively for Sofosbuvir which indicates excellent correlation between response factor Vs concentration of standard solutions. Precision of the developed method was studied under system precision and method precision. The %RSD values for precision was found to be within the acceptable limit, which revealed that the developed method was precise. The developed method was found to be robust. The%RSD value for percentage recovery Ledipasvir and Sofosbuvir was found to be within the acceptance criteria. The results indicate satisfactory accuracy of method for simultaneous estimation of the Ledipasvir and Sofosbuvir. The forced degradation study showed the method was highly specific.Conflict of Interest
Authors declared the no conflicts of interest.